

[ad_1]
Introduction
Apache Spark™ is a widely used open source distributed computing engine. It is one of the main components of Uber’s data stack.
Spark is the primary batch compute engine at Uber. Like any other framework, Spark comes with its own set of tradeoffs.
Problem Statement
Users who have worked with Spark understand that writing optimized Spark applications is not a straightforward task and requires a lot of configuration tuning, as well as code-level optimizations.
Given the scale of Spark applications at Uber (~100K+ applications per day) it becomes important for us to write optimized Spark apps to save on compute resources.
We acknowledge that not every user of Spark is a power user and they might not understand all the intricacies of the framework. This leads to users sometimes writing unoptimized Spark applications, which at Uber scale could lead to inefficient usage of compute resources.
This problem is not limited to Uber–this is an industry-wide challenge to write optimized compute workflows in order to use resources efficiently.
To tackle this problem of unoptimized Spark apps at Uber, we built Spark Analysers.
Architecture & Design

Component Terminology
| Drogon | Drogon is Spark as a Service offering at Uber |
| YARNRed (YARN Reduction) | Effort to bring down YARN consumption at Uber |
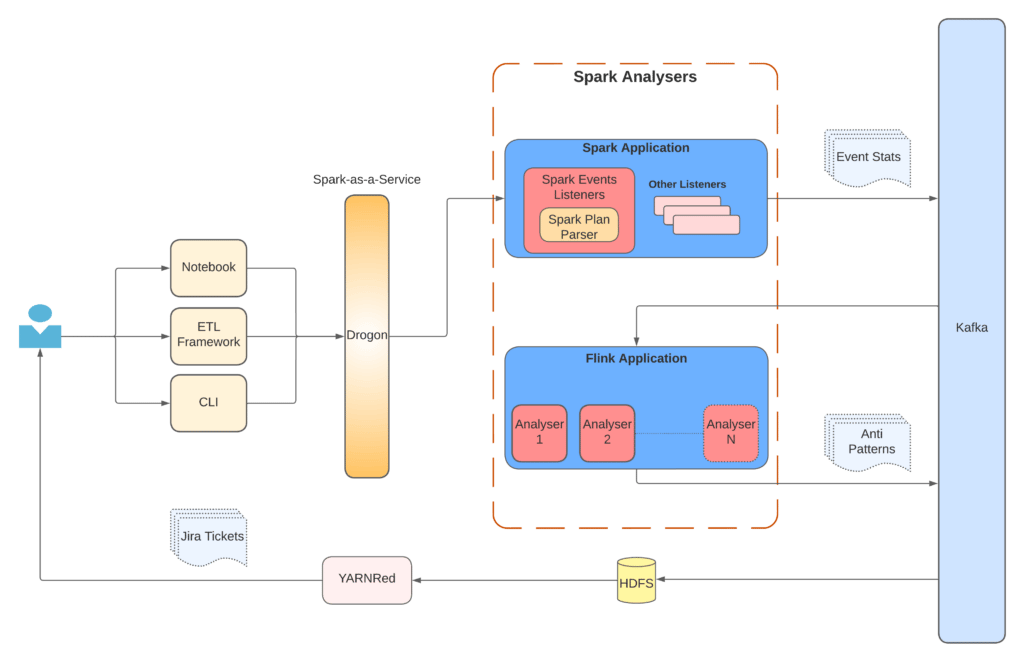
Spark Analysers
Spark Analysers is a set of components to detect anti-patterns in a Spark Application. The system contains 2 main components:
- Spark Event Listener
- Analysers – Flink application
Spark Event Listener
Spark Event Listener is a component that listens for a specific set of events that are emitted by the Spark framework when the Spark application is running.
We have many Spark Listeners at Uber, and one of them is specific to the Spark Analysers system. This listener implements the following two Spark Listeners:
- QueryExecutionListener
- SparkListener
And listens to following events:

The listener gets a lot of information about each running Spark query and the overall application. It parses out all this information to extract what can be used to detect a predefined set of anti-patterns.
One of the main entities that is parsed by the listener is the Spark Plan.

A Spark Plan is a Tree Data Structure where each node contains specific information about the operation being performed by the Spark application. The listener recursively traverses the Spark Plan and stops at nodes that might give useful information to detect anti-patterns.
Once all the information is collected from the current event, it is pushed to a Kafka® topic. This whole operation continues until the application ends.
Analysers – Flink Application
This component contains the concrete definition of anti-patterns and the implementation of each analyser. This is a real-time Apache Flink® application that is polling the Kafka topic where events are being published by the above-described Spark Event Listener.
This Flink application currently has 2 analysers that run for each Spark application:
- Excessive Partition Scan Analyser
- Duplicate Spark Plan Analyser
Excessive Partition Scan Analyser
At Uber, we have some recommendations for the data scan patterns for Hive™ tables, mentioned in the following diagram:

Analyser Design

This analyser looks at each event in the Kafka topic and checks whether it has information about Data Scan or not. If yes, then it checks what kind of table is being scanned and accordingly applies the threshold validations. If the thresholds breach, a new AntiPattern Event is created and pushed to a different Kafka topic.
This antipattern event contains information about the scan like tables being scanned, number of days of data being scanned, and the recommendation for data scan.
Since this analyser works at an event level, it is a stateless analyser and works independently of other events in the stream.
Duplicate Spark Plan Analyser

Another important characteristic of Spark is that it evaluates the plan lazily. Lazy evaluation means that no concrete action is performed unless the user asks for output from Spark. All the transformations are put in the Spark Plan, one after the other, but nothing gets evaluated unless the user tells Spark to execute the plan and give back the result.

Once the user asks for a result, the plan created so far is executed. But the interesting part is that if the user again asks for the same result, Spark recomputes the exact same plan again.
Consider an example where a user joins 4 tables in a Spark SQL and performs a count operation after some filtering of records. If the user asks for the count twice, Spark will perform the join between the 4 tables twice!
This results in a lot of complex computation, depending on the Spark Plan and the operation being performed again. To avoid such situations, users need to be aware of caching in Spark and writing the application code in a way that avoids such data recomputes.
Analyser Design

This analyser detects these duplicate plans in the application and recommends to users ways to avoid heavy data recomputes.
To identify duplicate plans, the listener needs to be aware of all the Spark Plans within the Spark application, and thus it needs to maintain a state per application, making this an stateful analyser.
As shown in the above analyser design diagram, it detects duplicate plans when the application ends or when the 2-hour timer expires and no new event is received from the application.

To identify whether a given Spark Plan has been seen before or not, the listener uses the semantic hash of the Spark Plan, which is pushed to the Kafka by the Spark Listener. Semantic hash allows the analyser to detect duplicate plans within a single run of a Spark application. Spark removes cosmetic changes before computing this hash, thus giving the same result for the same query within the application. The listener also publishes the plain hash of a Spark Plan, which does not change across runs but is different for the same query within the same application. We use semantic hash to detect duplicate Spark Plans within an application run. Plain hash can be used to detect duplicate Spark Plans across application runs, but that is not something we do today.
Example

An antipattern event is created on duplicate plan detections and is pushed to Kafka.
YARNRed – Jira Ticketing
YARNRed stands for YARN Reduction, which is an Uber-wide effort to reduce consumption of YARN resources and make resource usage more efficient. It targets the scheduled workloads.
Identification of Scheduled Spark Workloads
We have a fingerprinting logic (SHA1) in place for Spark apps and we use that unique signature to identify scheduled apps based on the workflow they are part of. Ad hoc spark apps have this set to null.
One of the main components of YARNRed is the Jira Ticketing Pipeline, which collects data from various sources and analyzes historical data in different windows (e.g., last 180, 30, and 7 days, respectively). Then the pipeline uses the history, applies rules to identify suggestions, and creates Jira tickets for the application owners to notify them of the potential savings that can be achieved if the suggested optimizations are applied to their applications (e.g., if workflows have a high failure rate).
Spark Analysers also helps with the same goal of YARN resource optimization in the case of Spark applications. So YARNRed now also consumes the output of Spark Analysers and identifies the candidates for ticket creation. In the case of Spark it creates Jira tickets for the below two scenarios:
- If there are too many partitions scanned for a particular table
- If there are duplicate Spark plans and respective Spark query runtime is greater than 10 minutes
We have an additional cost threshold filter check to avoid noise for the user by creating unnecessary tickets.
In the respective Jira tickets it also gives owners the insight of average resources consumed (virtual cores and memory) along with failure rate in the last 180 and 7 days, respectively.

Sample Jira ticket

This workflow takes care of periodic reminders every 2 weeks with detailed summary to owners to optimize their workloads.
The workflow is also designed in such a way that approved use cases are not being identified as candidates for ticket creation, again to avoid duplication of tickets.
Terminology Used
| vCores | CPU virtual cores utilized |
| uCores | Max (vCores, memory utilized/SKU ratio) |
| This SKU ratio is derived using the memory present per vCore in our YARN fleet. As of now, every 1 vCore maps to approximately 4.4GB of memory available in our YARN cluster | |
Considerations & Design Choices
One of the main considerations while developing Spark Analysers was to not impact the user applications in any way. Impacting user applications could upset the consumers of Uber’s Data Platform and create a bad experience for them. We care about user experience and wanted to make sure that whatever we do is abstracted from the users and none of the running applications are affected by all the processing of Spark Analysers.
To achieve the same, we made a design choice to decouple event stat collection from the actual analysis. Event stat collection performed by the Spark Listener is a lightweight operation and happens within the application context. Analysers do all the heavy lifting and hence sit outside the application as a separate, real-time Flink application.
Following are the design principles we followed for the development of Analysers:
| Pluggable | Easily develop new analysers and plug them into the existing system |
| Extensible | Extend existing analysers based on the use cases |
| Scalable | The Flink application can be scaled independently of the Spark application |
| Decoupled | The overall architecture is layered and decoupled so that each component can be scaled independently |
Results
Without any cost filtering we detect over 5000 anti-patterns across more than 1500 distinct applications every day.
After applying the above-mentioned cost function, we have identified ~150 candidates for ticket creation.
We are saving of 60k+ uCores annually with current detections and expect to see more as users continue to take action on the Jira tickets.
One of the challenges is getting application owners to take action on the Jira tickets and we regularly send reminders using the automated ticketing pipeline to get more and more traction on the Jira tickets.
Conclusion
Spark Analysers is a unique approach to solving Spark application inefficiencies at scale. We expect to investigate more anti-patterns and roll out new analysers to increase our coverage of anti-patterns.
The rollout of Spark Analysers would not have been possible without multiple Uber teams coming together. Our Data Platform teams are constantly working on improving the data offerings and bringing down the cost of the platform by identifying and applying optimisations as much as possible. Spark Analysers is one of the many efforts at Uber to improve resource usage for Spark applications, involving some efforts which can auto-apply the optimisation without needing any user action.
We at Uber continue to work to solve such common data problems, given our scale, even small improvements can add up to big savings!
Main Image Attribution: the image is from https://www.instaclustr.com/platform/managed-apache-spark/ as per Google images
[ad_2]
Source link

