Introduction
M3DB is a scalable, open-source distributed time-series datastore. It is used as persistent storage for the M3 stack, which enables metrics-based observability for all Uber services. These metrics are subsequently used for generating real-time alerts.
It has been 3 years since we last deployed the open source version of M3DB into Uber’s cloud. Since the last deployment, a series of performance enhancements have been added to the server code. Some of these enhancements include:
- Resource utilization improvements done in (V1.2.0) and (V1.5.0)
- Bootstrap performance Improvements – Improvements done in (V1.2.0)
- Bootstrap and Snapshot reliability – Improvements done in (V1.4.0)
Scope of Work
One of the reasons we have been running on an older version of M3DB despite the open source project introducing significant improvements is that we didn’t have a well-tested verification and rollout process for M3DB.
One of the primary goals of this effort was to figure out a repeatable and reliable way of rolling out M3DB into Uber’s cloud so that we are able to upgrade more consistently. We wanted to automate as many steps as possible while simultaneously coming up with a list of improvements for the next iterations of upgrading the M3DB fleet.
Scale & performance considerations
There is a basic version of an integration suite available in the open source project but that doesn’t apply at Uber scale ( 1 billion write RPS, 80 million read RPS, and approximately 6,000 servers).
Given the scale of operation of M3DB within Uber, even a 5-10% regression in performance/efficiency/reliability could be a serious risk to our observability platform. Evaluating the correctness of newer versions of M3DB is meaningless unless tested under production analogous scale.
Further, while operating at scale, one of the common scenarios is that the M3DB cluster is in a dynamic state–in the sense that nodes are added, removed, or replaced often and almost always triggered by underlying infrastructure automation. So the integration suite should test for functionality, correctness, and performance under those chaotic scenarios as well.
Quantifying concrete gains for Uber workloads
The changes in the open source version have shown performance improvements, but have never been tested in an environment as large and complex as Uber. There are no numbers available to indicate the exact gains we would see by moving to the latest workloads. Given the effort involved in vetting and releasing newer versions in M3DB, we need to justify the ROI to undergo this effort.
So part of the testing effort for a newer version would include running it under Uber production-analogous traffic and comparing key performance indicators against the existing version running in production to get a sense of how the open source version stands against Uber’s scale.
Rollout challenges
Given the huge cluster sizes (approximately 100 clusters with 5,500 nodes in total) as well as high allocation per node (28 cores and 230G memory per node currently), rolling out any change to M3DB also presents challenges in terms of reliability and operability. We want to evaluate a release process that is safe, stable, and needs the least amount of human effort or intervention.
Rollout Strategy
We have over hundreds of M3DB clusters running in production–sharded by retention period and availability zones. Each cluster can have hundreds of nodes and a vast majority of them average around 100 nodes/cluster. While the clusters themselves can be upgraded in parallel, within a cluster, we have an added constraint of only one node can be upgraded at a time–to avoid data loss as writes are performed at two-thirds majority quorum within Uber.
Testing Strategy
We have considered and implemented two broad testing strategies:
- Offline mode, where we run M3DB under various simulated/experimental synthetic test loads and benchmark for key client performance indicators, like correctness, latency, success rates. Additionally, we benchmark server performance characteristics like server response time, bootstrap duration, tick duration, and data persistence between restarts and replacements.
- Online mode, where we run M3DB under duplicated and sampled production traffic to observe for performance and correctness regressions against existing production clusters.
Offline Mode
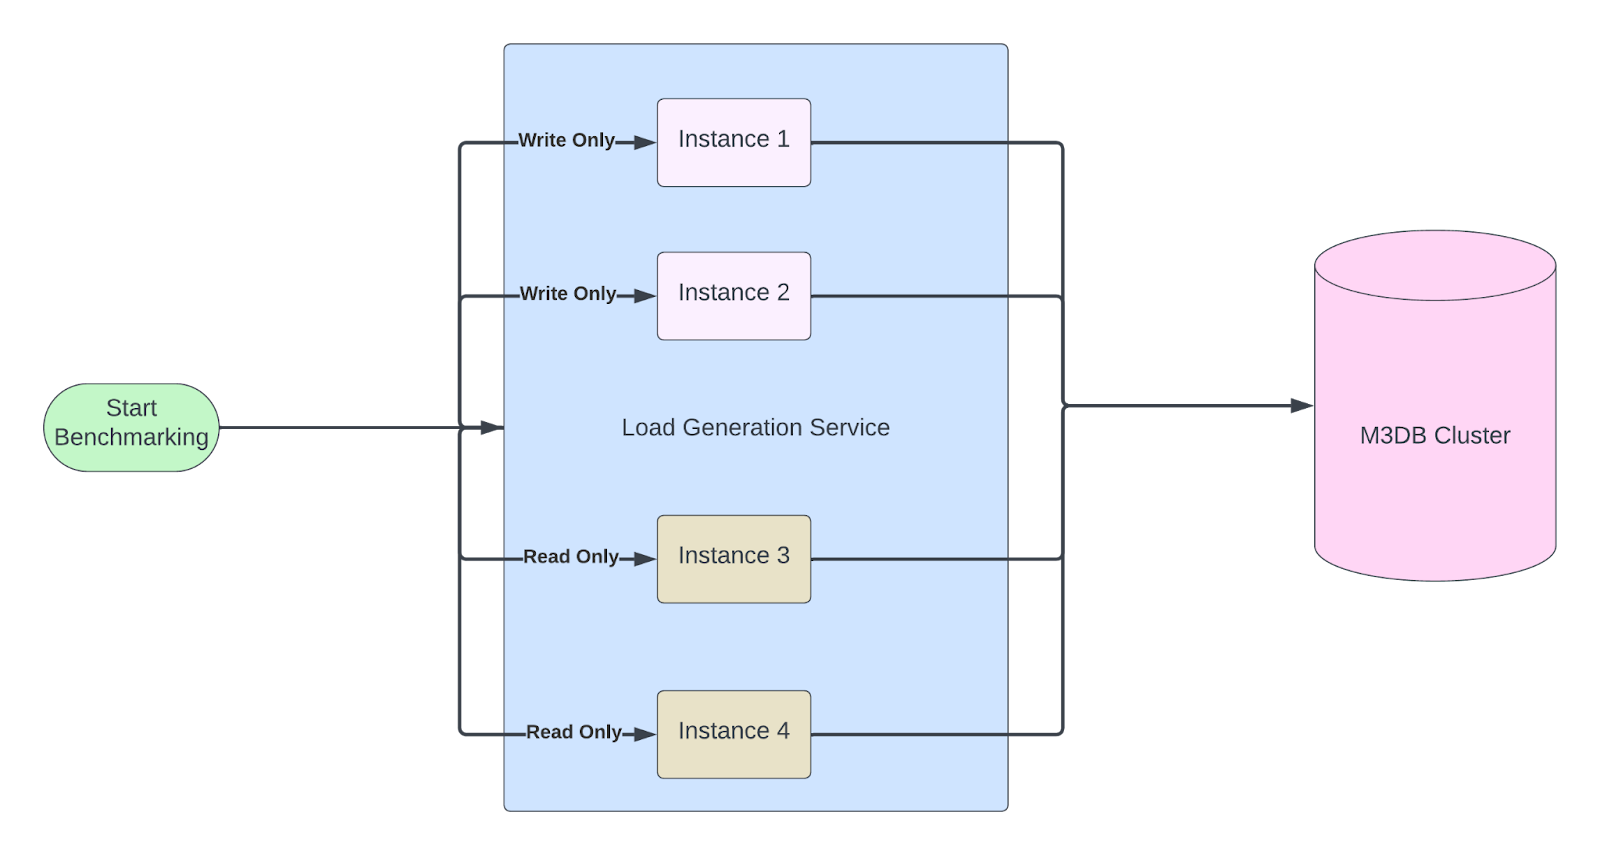
For the offline mode, we needed a M3DB benchmark tool that generates load at scale. The various scenarios against which the cluster needs to be tested are simulated by tweaking the input parameters to the benchmark tool or by tweaking the cluster setup as necessary. To scale our benchmarking tool to mimic or even surpass our production loads, we deployed our benchmarking tool service as a distributed service. We deployed powerful, high-capacity machines to subject the system to a significant workload. All the benchmarks were run on a newly created M3DB cluster with a cluster size of 10 nodes.
Test Scenarios
- Benchmark an M3DB cluster at older version – We run multiple benchmark tests on the older version and record the latencies and correctness of the M3DB cluster to establish baseline numbers.
- Run Topological Operations – Run benchmark suite while there are topological operations (node additions, removals and replaces) taking place within the cluster.
- Rollout new version – Run the benchmark suite when we do a deployment on the new version.
- Benchmark the newer version – Similar to above with the older version, we run the exact same benchmark tests with the newer version as well and collect the metrics for the same.
- Benchmark correctness – Run benchmark first on a write-only mode and record the metrics written in a file–later run the benchmark in a verification mode, which will try doing reads once the deployment of the newer version is complete.
The “a” and “b” points above will be done both when the cluster is on the older version of M3DB and once when the cluster is on the newer version.
The “c” and “d” points above are required when there is rollout to test in the in-transit test scenarios.
The “e” point talks about the correctness. Correctness is an essential requirement:
- When an upgrade happens, the old server will flush all the data to the disk and the new server version will start reading from the same data. We need to make sure that the new node is able to read the data flushed by the older version.
- We need to benchmark correctness in cases where the new version holds the data in the buffered state as well as the flushed state.
Online Testing
While the offline mode helps us explore the M3DB newer version on some of the key performance indicators for M3DB, it still doesn’t give us a lot of confidence on how a newer version would perform against Uber production scale and metrics payloads .
To gain this confidence, we ended up implementing a shadow traffic pipeline setup as shown below, where we can duplicate a configurable sample of writes and reads traffic to a shadow M3DB cluster with production traffic, albeit at a smaller scale.
There are two types of shadow testing considered:
- Shadow testing to compare older vs. newer versions running same percentage of production traffic
- Shadow testing to have proportional traffic and cluster size w.r.t. the production cluster and compared
Shadow testing against older version vs. newer version
We first created the shadow M3DB cluster with the older version and let it run for a few weeks so that we’d have a baseline number across various performance indicators like CPU, memory, bootstrap latency, tick duration, and server/client latencies. Afterwards the shadow M3DB cluster is upgraded to the latest version and the same performance indicators are measured and compared with the baseline numbers.
The online testing has 3 phases:
- Running the shadow cluster in older version of the M3DB to establish baseline
- Roll out the newer version of M3DB in shadow setup
- Measure time taken to rollout
- Observe for read/write failures
- Observe for any change in performance indicators
- Running the shadow cluster in the newer version of the M3DB to establish newer performance indicators and compare with base line numbers
- The newer performance indicators can then help quantity the improvements our production setups can gain by moving to the newer version
- Verify writes that were sent before rollout to be persisted post roll out
- Verify writes that were sent before rollout are persisted for node replaces
Shadow testing against production cluster
Decrease the shadow cluster size to production comparable size based on shadow traffic and compare performance against production numbers.
We want to have a proportional amount of read and write operations happening on a proportionally sized cluster. In this test setup as well we need to run topological operations on the shadow and the production setup to get comparison details.
Key Performance Indicators
We need to observe the following metrics in both of our testing strategies:
- System metrics: CPU, RSS memory, total memory, disk usage, file descriptors, and number of goroutines spawned by the M3DB process.
- Latency numbers: Client side and Server side read/write latencies.
- Success/Failures: Read/write requests that quorum succeeded vs. failed.
- Node/Peer Bootstrap Time: Whenever a new node comes up in the system, it is assigned a subset of shards available in the system. Now the node tries to bootstrap the data from the other peers, which also contain the replica data of those shards.
- Buffered Write Correctness: Whenever data is written to M3DB, the data is kept in the memory buffer of M3DB as governed by the namespace configuration, specifically the block size of the configuration. If the write was successful to the M3DB we should be able to query back the same data from the M3DB before it is flushed to the disk.
- Flushed Write Correctness: Similar to the buffered write correctness, when the block is flushed to the disk, the writes should be verifiable after being flushed to the disk.
Gains observed in testing
Memory Improvements
We observed roughly 20% in gain of memory utilization for the M3DB in the newer version.
CPU Utilization Improvements
Similarly we observed roughly 20% in gain of memory utilization for the M3DB in the newer version.
Node Bootstrap Time Improvements
Node bootstrapping happens whenever a new node is added to the topology of the cluster, this could either be when an old node is getting replaced or a new node is being added. Bootstrapping a new node when an old node is undergoing replacement is a long running operation in M3DB.
We had seen better performance while bootstrapping consistently in the newer version of the M3DB. There were many rounds of this test conducted and the newer version always turned out to be better.
| Node Size | Old Version (min) | New Version (min) | Improvement% |
| 80 GiB | 77 | 62 | 19.48% |
| 224 GiB | 218 | 170 | 22.00% |
| 518 GiB | 317 | 230 | 27% |
| 740 GiB | 424 | 365 | 14% |
Production Rollout
When all the tests were complete, we started with a staggered rollout to the production clusters.
Challenges in Production Rollout
Even after thorough benchmarking and production sample traffic testing, we encountered few challenges within the deployed cluster. Below, we outline these issues along with an explanation of why they proved elusive during benchmarking and detail the ultimate solutions implemented to address them.
Tail Latency Spikes
Shortly following deployment, we noticed a notable increase in tail latencies for write operations, particularly at the P85 percentile and beyond.
In order to identify the root cause of the issue, we reverted several nodes in the cluster to the previous version while maintaining the newer version on the remaining nodes. Subsequently, we initiated a comparison of CPU profiling between the two versions. Then we were able to isolate it to a simple method, which was problematic. We then fixed the issue which was causing the regression and the latencies dropped after that.
Below are some images from the cpu profiling exercise:

As we can observe from the above images, the problematic method reduced its footprint significantly after it was fixed.
When we rolled out this new version, our client latencies dropped back to normal again, as shown below:
We contributed this fix back to the upstream open source repository–details of the changes can be found at: Github Pull Request#4253.
Data Loss During the Upgrade
During the rollout process, all the nodes in the cluster undergo a version upgrade sequentially. This involves bringing down the existing node and bringing it back up in the newer version. Due to this, the node loses the data it was holding in memory and also misses the writes that came in during the time window it was down. The node tries to recover this data by bootstrapping and fetching the data from the peers.
Post the rollout in a cluster our clients observed that they were facing issues in the read quorum. This basically means that the client was observing an elevated number of reads where only one replica in the cluster had data and other two replicas didn’t have any data.
We isolated a single query out of many queries, then we were able to check the individual replicas of the shard and were able to find that there was a loss of data, and the timeframe of the lost data matched with when the nodes were upgraded. We observed that one replica had data and the other two replicas were missing data. We then correlated this with the fact that the replica which had more data was able to flush data to the disk before the upgrade happened for the other two replicas. Flushing is dependent on the namespace configuration, hence if the namespace configuration states that flush should happen once in 24 hours, all the nodes would undergo a flush cycle in almost the same time.
This issue turned out to be a misconfiguration issue in the end, where we had to specify the correct bootstrapper mode for the database, only after which it tried to bootstrap the data it lost during the upgrade from the peers. We were using a default bootstrap configuration, but we should ideally be specifying mode as in “prefer_peers” or “exclude_commitlog”, the former means before bootstrapping from the commit log give preference to peers and the latter means exclude the commit log bootstrapping completely. We went ahead with the latter as we haven’t really employed WAL in our production workloads.
Gains observed in production after rollout
The production servers are memory-bound rather than CPU-bound, hence we were able to observe a drop in the memory usage significantly and not the CPU usage. The same can be seen below:
Node bootstrap time improvements also aligned with our findings in the offline testing phase and helped us improve the stability of the clusters of the production.
Conclusion
Plans for Contribution back to open source project
There are several things that we want to contribute back to the project:
- The benchmarking utility which helped in benchmarking the new version at the production scale.
- A description of the data loss episode (and how to work around it) for the documentation.
The journey of upgrading a high-QPS, low-latency time series database in production, especially at the scale of companies like Uber, is undoubtedly filled with numerous challenges and struggles. Some of our key learnings include:
- Upgrades should be a continuous process instead of being done once in a blue moon.
- Dealing with open source Software is always challenging, hence we should have ways to:
- Evaluate correctness/performance at scale.
- Have standard staggered rollouts and rollbacks mechanisms in place.
- Have a data-driven approach on validating every assumption/claim with respect to comparing between the two release versions.
From navigating complex technical issues to managing the delicate balance between performance optimization and maintaining uptime, each obstacle presents an opportunity for growth and learning. As engineers tackle these challenges head-on, they develop a deeper understanding of system architecture, scalability, and resilience.
Moreover, the process of upgrading such critical infrastructure fosters a culture of innovation and collaboration within engineering teams. Through teamwork and collective problem-solving, engineers can overcome even the most daunting of obstacles, ultimately leading to a more robust and efficient system.
Cover Photo Attribution: “Nature” by ChrisA1995 is licensed under CC BY 2.0.


